
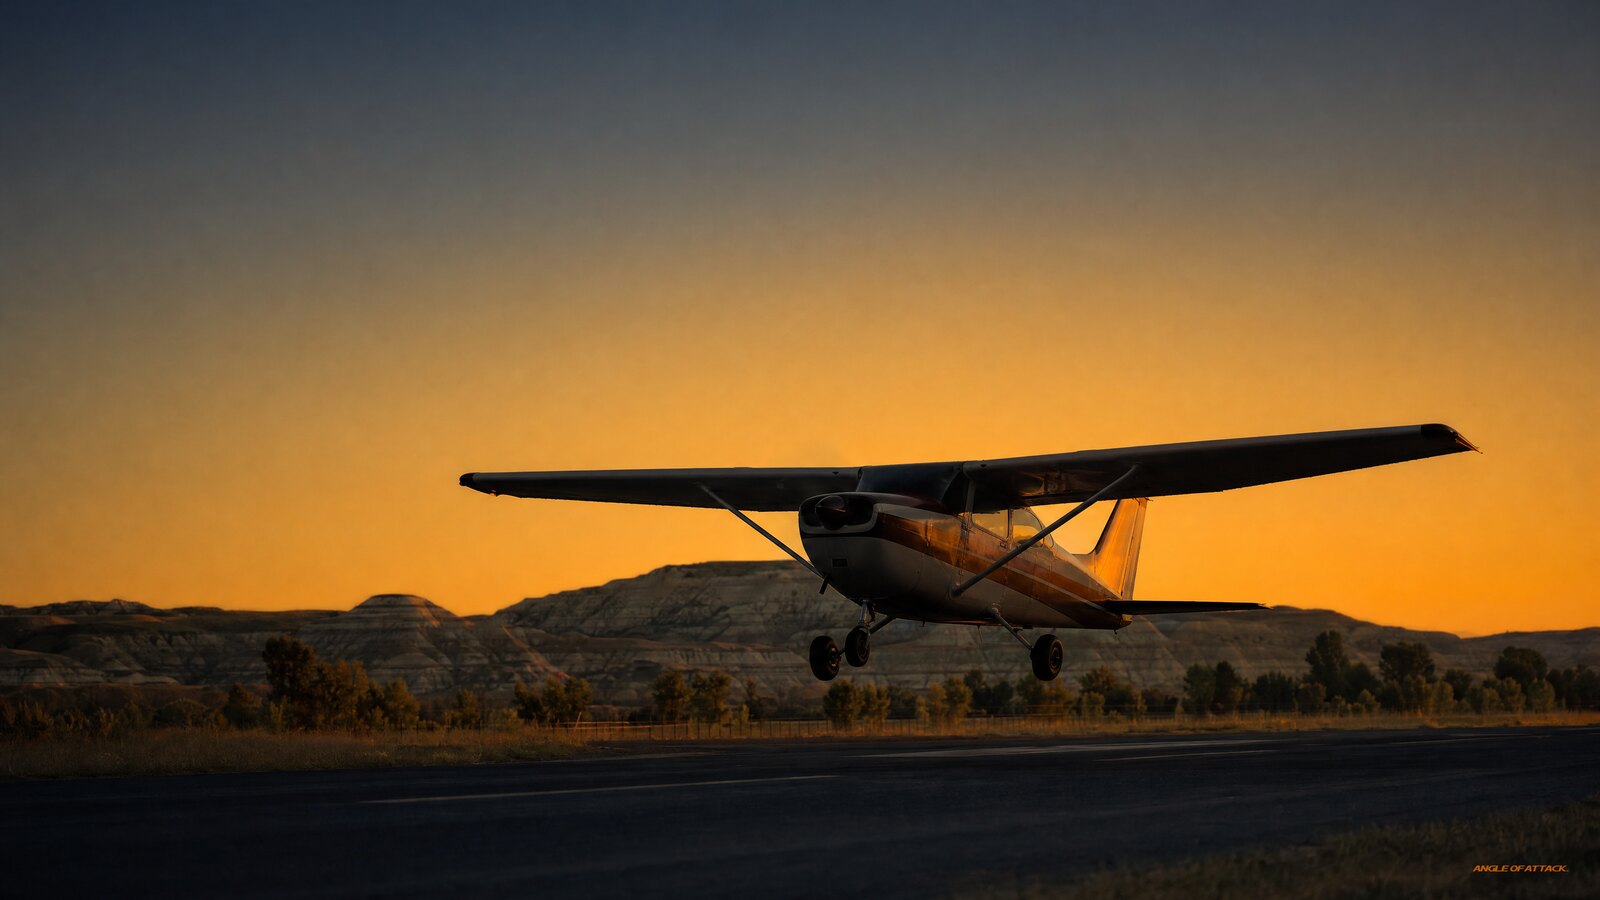
What Is Takeoff Distance? Reading Your POH Performance Charts
Takeoff distance in aviation is the runway length your airplane needs to accelerate from a standstill, lift off, and climb to a specified obstacle height — usually 50 feet. It comes in two parts: the ground roll (wheels-on-the-pavement) and the total distance to clear that 50-foot obstacle. You read it straight out of your POH performance charts. Both numbers change with weight, wind, temperature, pressure altitude, and runway surface — and getting them wrong is how a routine departure runs out of pavement.
Most students treat the takeoff chart as a checkride formality — a box to tick, a number to memorize. That’s a mistake. The takeoff chart is the one piece of preflight math that tells you whether the airplane will actually clear the trees at the end of the runway on the day you’re flying. Let’s make reading it second nature.
- Takeoff distance has two numbers. The ground roll is the distance to lift off; the total takeoff distance includes the climb to clear a 50-foot obstacle. Your POH gives you both.
- The chart assumes a paved, level, dry runway. Grass, slope, and standing water all add distance, and the POH usually gives you a correction factor for each.
- Density altitude is the dominant variable. Hot, high, and humid conditions thin the air and stretch your takeoff roll dramatically — often by hundreds or thousands of feet.
- Headwind shortens it, tailwind lengthens it fast. A small tailwind component costs far more runway than the same headwind saves, which is why tailwind takeoffs are a trap.
- Weight changes everything. Heavier means faster liftoff speed and a longer roll; the chart only applies at the weight you actually loaded.
- Charts are unfactored test data. As the FAA’s Pilot’s Handbook of Aeronautical Knowledge (PHAK, FAA-H-8083-25C) explains, these numbers come from a new airplane flown by a test pilot under ideal conditions — pad them for the real world.
WHAT’S IN THIS GUIDE
- 1What Is Takeoff Distance in Aviation?
- 2What’s the Difference Between Ground Roll and Total Takeoff Distance?
- 3How Do You Read a POH Takeoff Performance Chart?
- 4What Factors Increase Takeoff Distance?
- 5How Do Wind and Runway Surface Change Your Numbers?
- 6Why Should You Add a Safety Margin to POH Numbers?
- 7A Story From Alaska: The Gravel Bar That Got Longer
- 8PLT Study Guide
- 9Frequently Asked Questions
What Is Takeoff Distance in Aviation?
Takeoff distance is the total runway length an airplane needs to accelerate from rest, become airborne, and climb to a defined obstacle height — 50 feet for most light airplanes. The FAA describes this in the Pilot’s Handbook of Aeronautical Knowledge (PHAK, FAA-H-8083-25C) and the Airplane Flying Handbook (AFH, FAA-H-8083-3C). It is the single performance number that answers the real question: will I clear what’s at the end of this runway?
Think of it as a two-stage event. First the airplane has to reach flying speed while still on the ground. Then, once the wheels leave, it has to climb steeply enough to clear whatever is past the pavement — trees, a fence, a power line, rising terrain. Your POH (Pilot’s Operating Handbook) publishes both distances so you can match them against the runway you’ve actually got.
The reason this matters more than students expect is that the takeoff is the most performance-limited phase of flight. The airplane is heavy, slow, low, and at full power with no margin to spare. If the numbers don’t work, you find out at the worst possible moment.
What’s the Difference Between Ground Roll and Total Takeoff Distance?
The ground roll is the distance from brake release to the moment the wheels leave the pavement. The total takeoff distance is longer — it adds the airborne segment needed to climb to a 50-foot obstacle height. In a typical light trainer the climb-to-50-feet portion can nearly double the ground-roll figure, so confusing the two numbers can leave you badly short of runway.
Your POH lists both because they answer different questions. Ground roll tells you whether you’ll get airborne before the pavement ends. Total distance over a 50-foot obstacle tells you whether you’ll actually clear the obstruction sitting past the runway. On a wide-open field with nothing ahead, ground roll might be your limiting number. With trees at the departure end, the 50-foot distance is the one that keeps you alive.
| Term | What It Measures | When It’s Your Limiting Number |
|---|---|---|
| Ground roll | Brake release to liftoff | Long, clear runway with no obstacles ahead |
| Total takeoff distance (over 50 ft) | Brake release to 50 feet above the surface | Obstacles at the departure end — trees, fences, terrain |
| Accelerate-stop distance (some POHs) | Accelerate to liftoff speed, then abort and stop | Short runway where a rejected takeoff is a real concern |
Here’s the trap. A student reads “ground roll: 945 feet,” looks at a 2,000-foot runway, and feels great. But the total distance to clear 50 feet might be 1,800 feet — and if there’s a tree line at the end, that comfortable margin just evaporated. Always check the number that matches the obstacle environment in front of you.
How Do You Read a POH Takeoff Performance Chart?
You read a POH takeoff chart by entering it with your actual conditions — pressure altitude, temperature, and weight — and reading out the matching ground roll and total distance. Cessna-style tables list pressure altitude down the side and temperature across the top, with a weight block for each. You find the intersection of your conditions, then apply the chart’s printed correction notes for wind and runway surface.
Start by gathering your real inputs. Set 29.92 in. Hg to read pressure altitude, get the current temperature, and know your actual takeoff weight from the weight-and-balance you just ran. Don’t use round numbers from memory — use what the day and your loading actually give you.
Then enter the table. Find your pressure altitude row, slide across to your temperature column, and read the ground roll and the total distance to clear 50 feet. If your numbers fall between rows, interpolate toward the more conservative (longer) value — never round in the direction that flatters the airplane.
Finally, apply the notes. Almost every takeoff chart has fine print: subtract a percentage for each so-many knots of headwind, add a percentage for tailwind, and add a percentage for a dry grass runway. Those notes are part of the chart, not optional extras. Skipping them is one of the most common ways students underestimate the runway they need. We walk students through these exact charts step by step inside the Total Student Pilot course, because chart-reading is a skill you build by repetition, not by reading about it once.
What Factors Increase Takeoff Distance?
Takeoff distance increases with high density altitude, heavier weight, tailwind, soft or wet runway surfaces, and an uphill slope. Each factor reduces acceleration, raises the speed needed to fly, or both. They also stack — a hot day at a high-elevation field with a full cabin and a slight tailwind can easily double or triple the book number from a cool day at sea level.
Density altitude is the heavy hitter. When the air is hot, high, or humid, it thins out, and thin air robs the wing of lift, the propeller of thrust, and a normally aspirated engine of power all at once. That means slower acceleration and a higher true airspeed required for liftoff — a longer roll on both counts. This is exactly why the takeoff chart asks for pressure altitude and temperature.
Weight is the next big one. A heavier airplane has to reach a higher speed before the wing makes enough lift to fly, and it accelerates more slowly getting there. The chart only applies at the weight you actually loaded, so a takeoff figure for 2,200 pounds is meaningless if you’re sitting at 2,400.
Runway condition and slope round it out. Grass, soft dirt, snow, or standing water add rolling resistance and stretch the ground roll. An uphill slope fights your acceleration the whole way. None of these are in the base chart number — they live in the correction notes, and you have to apply them yourself.
How Do Wind and Runway Surface Change Your Numbers?
A headwind shortens takeoff distance because the airplane reaches flying airspeed at a lower groundspeed; a tailwind lengthens it because you must accelerate to a higher groundspeed to reach the same airspeed. Runway surface matters too — a dry grass runway can add roughly 15 percent to the ground roll in many light-airplane POHs, and soft, wet, or snow-covered surfaces add even more. Always apply your specific POH’s correction figures.
The wind asymmetry catches pilots off guard. The math isn’t symmetric — a tailwind hurts you more than the same headwind helps you. That’s why taking off downwind “just to save a taxi” is such a classic, avoidable mistake. The FAA’s Airplane Flying Handbook (AFH, FAA-H-8083-3C) is blunt about respecting wind direction on takeoff for exactly this reason.
Runway surface is about friction and drag. Pavement is the chart’s baseline. Grass, dirt, gravel, and snow grab at your tires and slow your acceleration, so you eat more runway before liftoff. Standing water and slush are their own hazard category — they add drag and can mask other problems. Your POH note will give you a percentage to add; use it, and round up.
Don’t forget runway slope, which the chart usually doesn’t bake in at all. An uphill takeoff is slower; a downhill one is faster but tempts you into ignoring a tailwind. When slope and wind disagree, the wind almost always wins the argument for which way to depart.
Why Should You Add a Safety Margin to POH Numbers?
You should pad POH takeoff numbers because the charts represent best-case data — a brand-new airplane, a sharp test pilot, perfect technique, and a clean engine. The FAA’s Pilot’s Handbook of Aeronautical Knowledge (PHAK, FAA-H-8083-25C) cautions that real-world performance is almost always worse than book figures. Your trainer is older, your technique is still developing, and the engine may not be making full rated power.
A common, conservative habit among working pilots is to add 50 percent to the published takeoff distance and treat that as the runway you actually need. So if the book says 1,800 feet to clear 50 feet, you want roughly 2,700 feet available before you commit. That margin absorbs an old airframe, a slightly long rotation, a gust that dies at the wrong moment, and the dozen small things the chart never saw.
This isn’t about being timid. It’s about flying with margin instead of hope. The accident reports the FAA references in PHAK are full of airplanes that needed every published foot and didn’t have the cushion when conditions turned out a little worse than the chart promised. Build the pad in before you ever taxi out.
If you want to turn this from a checkride chore into a real go/no-go skill, that’s exactly what we drill inside the Private Pilot Ground School — running the chart for the day in front of you and making confident decisions about the runway you’ve got.
A Story From Alaska: The Gravel Bar That Got Longer
Up in Alaska, the takeoff chart stops being theory in a hurry. I remember a warm summer afternoon on a gravel bar along a river — the kind of strip where the “runway” is whatever the spring flood left you. In the cool of the morning, that same bar had felt generous. By mid-afternoon, with the sun beating down and a couple hundred extra pounds of gear in the back of the 172, the math had quietly turned against me.
Here’s what gets you: nothing looked different. Same gravel, same river, same spruce at the end. But the temperature had climbed, density altitude had crept up, the gravel was eating my acceleration, and I was heavier than the morning run. Run the numbers — really run them — and that comfortable strip needed noticeably more length than I had margin for. Not dangerous-close, but closer than I’d want to discover on the roll.
So I did the unglamorous thing: I split the load, flew the gear out in two trips, and waited for the temperature to back off the worst of the afternoon. Boring. Safe. The right call.
The lesson I hand every student: the chart isn’t pessimistic, it’s honest. The airplane doesn’t care that the strip felt fine at 8 a.m. It cares about the air, the weight, and the surface right now. Run it for now, add your margin, and let the numbers — not your optimism — make the go/no-go call.
PLT Study Guide
The FAA tags every knowledge-test question with a PLT (Pilot Learning Statement) code. These are the codes that map directly to takeoff distance and takeoff performance charts. Learn the concept behind each one and you’ve covered the whole cluster the way the FAA frames it on the test.
| PLT Code | Official FAA Learning Statement | What It Means for This Topic |
|---|---|---|
| PLT011 | Calculate aircraft performance – takeoff | The core code: enter pressure altitude, temperature, and weight into the POH chart and read out ground roll and total takeoff distance. |
| PLT134 | Recall aircraft performance – takeoff | Know how weight, density altitude, wind, and surface qualitatively change the takeoff roll and distance to clear 50 feet. |
| PLT085 | Interpret information on Takeoff Obstacle / Field / Climb Limit Charts | Read the obstacle/field-length side of the takeoff chart — the total distance to clear a 50-foot obstacle, not just ground roll. |
| PLT089 | Interpret Takeoff Speeds Chart | Pull the correct rotation and liftoff speeds for your weight; higher weight means a higher speed and a longer roll. |
| PLT127 | Recall aircraft performance – density altitude | Thin air from hot/high/humid conditions is the dominant factor that lengthens the takeoff roll and weakens the initial climb. |
If you’re studying for the Private Pilot knowledge test, don’t just memorize a takeoff distance. Practice the chain: enter the chart with pressure altitude, temperature, and weight; read both ground roll and total distance; then apply the wind and surface notes. When you can defend why each input moved the number, the test questions answer themselves.
Frequently Asked Questions
What is takeoff distance in aviation in simple terms?
Takeoff distance is the runway length your airplane needs to accelerate from a stop, lift off, and climb to a 50-foot obstacle height. It comes in two parts: the ground roll to get airborne and the longer total distance to clear the obstacle. You read both straight out of your POH takeoff performance chart.
What’s the difference between ground roll and takeoff distance?
Ground roll is the distance from brake release to the moment the wheels leave the runway. Total takeoff distance adds the airborne climb to clear a 50-foot obstacle, so it’s always longer. Use ground roll on a long clear runway; use the 50-foot distance whenever there are trees, fences, or terrain past the departure end.
Why is takeoff distance measured to 50 feet?
The 50-foot height is a standard obstacle-clearance reference the FAA uses so charts are comparable and conservative. It represents clearing typical departure-end obstructions like trees or a fence. Measuring only to liftoff would ignore the climb segment, where a heavy, hot, or underpowered airplane can fail to outclimb what’s waiting past the runway.
What increases takeoff distance the most?
High density altitude usually has the largest effect — hot, high, and humid air thins out and robs lift, thrust, and engine power at once. Weight, tailwind, soft or wet runway surfaces, and uphill slope all add distance too. These factors stack, so a hot, heavy day at a high field can multiply your book takeoff distance.
How much does a tailwind add to takeoff distance?
A tailwind hurts more than the same-strength headwind helps, because you must accelerate to a higher groundspeed to reach flying airspeed. Your POH gives a specific percentage to add per knot of tailwind. The safest habit is simple: don’t take off downwind to save a taxi — the runway penalty isn’t worth the convenience.
Should I trust the POH takeoff numbers exactly?
No. POH charts come from a new airplane flown by a test pilot under ideal conditions, and the FAA’s PHAK (FAA-H-8083-25C) warns real performance is usually worse. A common, conservative habit is adding 50 percent to the published distance and using that as the runway you actually need before committing to the takeoff.
Does runway surface really change takeoff distance?
Yes. The chart’s baseline is a dry, level, paved runway. Dry grass can add roughly 15 percent to the ground roll in many light-airplane POHs, and soft dirt, snow, or standing water add even more drag and distance. Always apply your specific POH’s surface correction note rather than guessing at the penalty.
How do I calculate takeoff distance from my POH?
Get your real inputs: pressure altitude (altimeter set to 29.92 in. Hg), current temperature, and actual takeoff weight. Enter the takeoff chart at your pressure altitude row and temperature column, read the ground roll and total distance, interpolate toward the longer value, then apply the wind and surface correction notes printed on the chart.
Master every system on your checkride — and on day one.
The Private Pilot Ground School breaks down every FAA subject area in the same plain-English, real-world way you just read — with quizzes, scenarios, and the explanations that finally make it click.
Takeoff distance is the one preflight number that decides whether the airplane clears the trees at the end of the runway on the day you’re actually flying. Run the chart for the real conditions in front of you, apply every correction note, add your safety margin, and let the numbers make the go/no-go call. Do that every time and you’ll be day-one ready, not just checkride-ready.


ON THE SAME TOPIC
Atmospheric Lapse Rate Explained: The One Number That Predicts Turbulence, Clouds, and Storms
Atmospheric Lapse Rate Explained: The One Number That Predicts Turbulence, Clouds, and Storms 26 min read Last updated June 2026 · Chris Palmer The atmospheric lapse rate is the rate at which air temperature decreases as you climb in altitude. In the standard atmosphere, temperature drops about 2°C per 1,000 feet (roughly 3.5°F per 1,000 […]
 Read more
What Is the ARROW Acronym? The Documents Every Aircraft Must Carry
What Is the ARROW Acronym? The Documents Every Aircraft Must Carry 17 min read Last updated June 2026 · Chris Palmer ARROW is the memory aid pilots use to remember the documents an aircraft must carry to be legal for flight: Airworthiness certificate, Registration certificate, Radio station license, Operating limitations, and Weight and balance data. […]
Read more 
What Is the Angle of Attack Indicator? The Gauge That Tells You How Close You Are to a Stall
What Is the Angle of Attack Indicator? The Gauge That Tells You How Close You Are to a Stall 16 min read Last updated June 2026 · Chris Palmer An angle of attack indicator is a cockpit instrument that shows the wing’s current angle of attack — the angle between the wing and the oncoming […]
Read more 
The Aircraft Fuel System Explained: How Avgas Gets From Tank to Engine
The Aircraft Fuel System Explained: How Avgas Gets From Tank to Engine 15 min read Last updated June 2026 · Chris Palmer The aircraft fuel system is the network of tanks, lines, valves, pumps, and gauges that stores aviation fuel and delivers it to the engine at the right pressure and flow. In light trainers […]
Read more 
Stay Connected
Be the very first to get notified when we publish new flying videos, free lessons, and special offers on our courses.
